
Marketing Campaign Analysis
Date Update: 2023 August 10th
The business problem for this marketing analytics project is to assess and compare the effectiveness of five different marketing campaigns in terms of customer response. The aim is to identify the best-performing campaign, which generates higher customer engagement, and to predict who will respond to the offer in the campaigns
ABOUT THIS PROJECT
Business Objective
Analyzing the effectiveness of our marketing campaigns is essential in today's competitive digital landscape. By leveraging data-driven insights, we can pinpoint which campaigns resonate most with our target audience and which strategies yield the highest ROI. This information equips both our marketing and sales teams to optimize their strategies for customer engagement and conversion. Ultimately, such analysis informs budgetary decisions for senior management and guides the organization toward informed decisions and sustainable growth.
Machine Learning
Used Python for all stages of data preprocessing and modeling in this project, including:
K-means clustering, STP analysis, and Linear Support Vector Machine. In addition, we used Python to implement two experimental techniques, including Two-Sample T-Test and ANOVA
Data Analytics & Dashboards
Overview Dashboard
The Overview Dashboard, powered by Microsoft Power BI, provides a concise view of core data, allowing stakeholders to quickly grasp key information and explore details without switching tools.
Marketing Insights Dashboard
This dashboard offers a detailed analysis of the dataset, spotlighting subtle trends using Power BI's interactive capabilities. Users can dig deeper to understand hidden data stories.
Model Dashboards
Visualizing our data modeling results, these dashboards, integrated with Power BI, present strategic recommendations backed by solid data insights and encourage collaborative strategy refinement.
Result
One of the key findings: Dormant Customers, who previously engaged with the brand but have since become inactive, present a valuable re-engagement opportunity. Addressing their concerns and understanding their reasons for disengagement can lead to efficient ROI maximization. On the other hand, Premium Customers, recognized for their high purchase frequency and significant spending, play a pivotal role in a business's revenue and reputation. Prioritizing their needs and providing exclusive services not only boosts revenue but also fosters enduring brand loyalty, ensuring sustainable business growth. Addressing both segments' unique needs is crucial for a brand's holistic success.
INSIGHTS
Evaluating Campaign Efficacy, Tracking Channel Preferences, and Understanding Product Dominance
The overview dashboard delivers a succinct synthesis of pivotal metrics, granting stakeholders rapid comprehension of core trends. An analysis of campaign effectiveness clearly delineates Campaign 4 as the most resonant with our audience, contrasting with the suboptimal performance of Campaign 2. Temporal data extracted from our timeline chart underscores a sustained preference for in-store shopping. However, it also highlights the emergent prominence of web purchases, while catalog transactions appear to be receding, potentially indicative of broader digital shifts or waning interest. An anomaly in July 2012 suggests potential external impacts on purchase behaviors. Further, an examination of product preferences via the aster plot reaffirms wine's market dominance, closely followed by meat products.


Customer Demographics: Marital Status, Education, and Income Distribution

The data indicates that a majority (64.58%) of customers are in relationships, followed by singles at 21.6% and separated individuals at 13.82%. Predominantly, over 50% of all groups have attained a bachelor's degree, with the next significant education level being a PhD. Income distribution remains consistent across these demographics. Such insights underscore the influence of a bachelor's degree on consumer engagement, irrespective of marital status, and suggest potential avenues for targeted marketing strategies considering the uniform buying power within this demographic.
Click to see Interactive Sunburst Chart Demo (JavaScript)
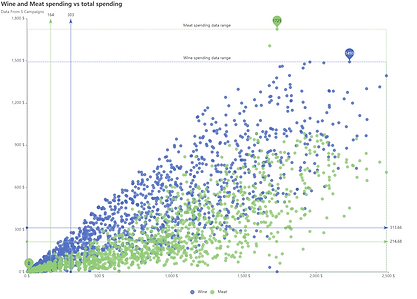
Expenditure Dynamics: The Delicate Balance Between Daily Necessities and Luxuries
Our advanced scatter plot analysis comparing wine and meat spending reveals intricate consumer behaviors. While meat expenditure displays a broad spectrum due to its status as a dietary staple influenced by individual habits and cultural practices, wine spending, though more limited in range, shows a higher average outlay. This could be due to perceptions of wine as a luxury or the inclination towards premium varieties. Sociocultural practices surrounding wine, such as gifting or collecting, might also drive purchases of pricier bottles. These patterns underscore the nuanced consumer spending dynamics: while meat sees varied expenses, specialized products like wine draw more substantial average investments. Insights hint that wealthier older generations, with their accumulated wealth and sophisticated palates, could significantly influence the higher wine spending trend.
MACHINE LEARNING
Navigating the Customer Landscape: Modern Techniques in STP Analysis
egmentation: Subdivide the broad market into smaller submarkets or customer groups with similar characteristics. These characteristics can be based on many factors, such as the consumer's age, gender, income, geographic location, spending habits, etc. Segmenting the market helps companies to better understand the needs and expectations of customers so that they can provide more targeted products or services. We then use the Elbow Method, analyzing the sum of squared errors from K=1 to K=20, to determine optimal cluster numbers.
S
argeting: Used the RFM (Recency, Frequency, Monetary) analysis which involves categorizing customers based on when their last purchase was (recently), how often they make purchases (frequency), and how much they spend (monetary value).
t
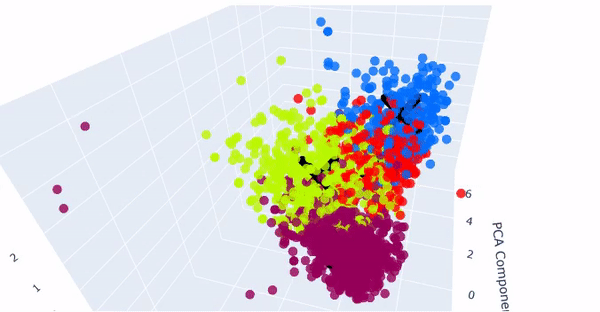

ositioning: Employed Principal Component Analysis (PCA) to identify key variables from our data set. By fitting the PCA model and plotting cumulative explained variance against the component count, we determined the optimal number of principal components to capture the data's primary variance.
p

